
Every ester on one axis
Stack short and long esters in the same cycle and the chart adds them together day by day, so overlaps and gaps become obvious.
A free steroid cycle calculator. Enter your compounds, doses and frequency, and CyclePlotter draws the estimated blood level for every one of them — a blast, a cruise or a TRT protocol — across the whole timeline.
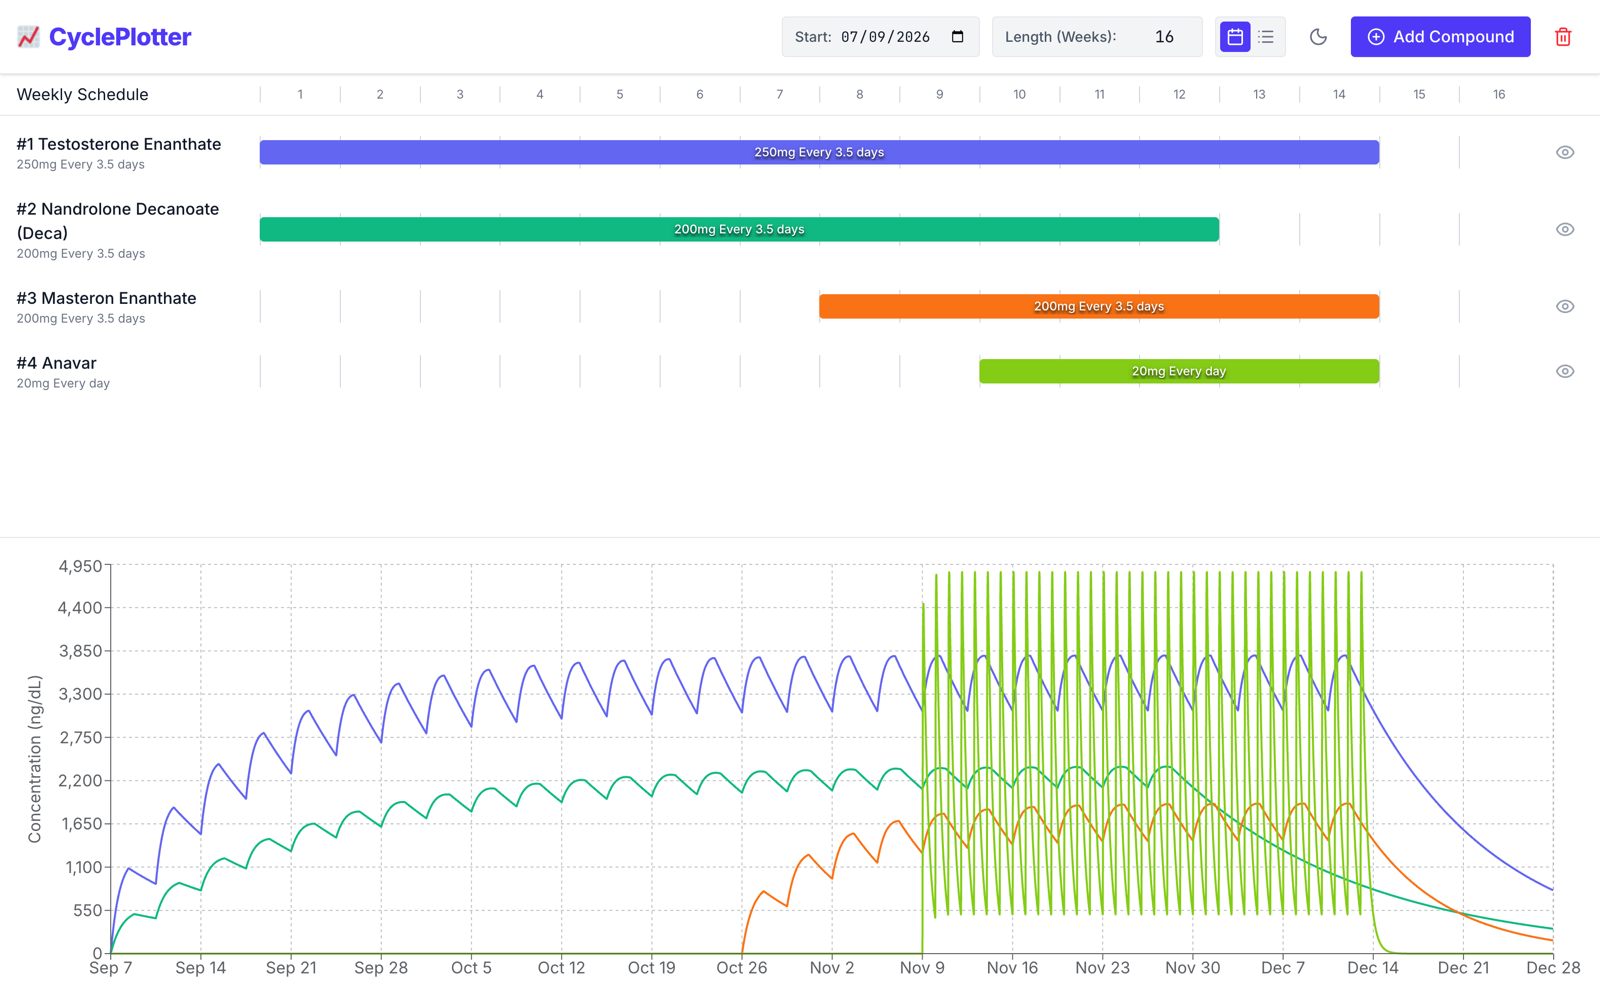
Propionate, enanthate and undecanoate all carry the same base compound. The ester decides how fast it arrives and how long it stays, and that is the part a spreadsheet cannot show you.
Stack short and long esters in the same cycle and the chart adds them together day by day, so overlaps and gaps become obvious.
Plan a blast, a cruise and the taper between them on a single timeline up to 50 weeks long.
Each compound carries its own peak, time to peak and half-life, so a 50 mg oral and a 50 mg injection are not treated as the same thing.
The weekly grid sits directly above the chart. Click any compound to change its dose or its weeks, and the curve redraws underneath it.
Your cycle is saved to local storage on your own device. No account, no server copy, nothing to delete later.
The plotter runs entirely on your device. Your compounds, doses and dates are written to local storage, never to a server, and there is no account to create in the first place.
Half-life, esters, accumulation and clearance, explained from the same published data the calculator runs on.
Half-life is the time it takes a blood level to fall by half. It sets how fast a compound leaves, how much it accumulates dose to dose, and how long a schedule takes to settle — and it says nothing at all about how strong the compound is.
On an unchanged schedule, a blood level climbs for about five half-lives before it stops rising. For testosterone enanthate that is roughly five weeks; for undecanoate it is closer to three months. Here is why, and what the climb looks like.
Two esters, one carbon apart, with half-lives close enough that the curves sit almost on top of each other. Here is what the pharmacokinetics actually separate them by — and how little that is.
The blood level falls to a few percent of its peak after about five and a half half-lives. That puts an oral at a couple of days and a long ester at several months — and it is a different question from how long a test can detect it.
An estimated serum concentration in ng/dL. Each dose rises to a peak anchored to a published pharmacokinetic study, then decays at the compound half-life, and the plotter sums every active dose for that day across the whole cycle.
No. The curve is built from population averages in published studies, and real levels vary widely with metabolism, body composition, injection site and genetics. Treat it as the shape of a schedule and a rough scale, not a prediction of your labs.
Because each dose lands before the previous ones have cleared. It takes roughly five half-lives to reach a steady level, so testosterone undecanoate at a 20 days half-life is still climbing for about 14.3 weeks, and nandrolone decanoate for about 7.3 weeks. That accumulation is the thing most people miscalculate on paper.
Yes. 23 injectables and 10 orals are in the model, each with its own half-life and bioavailability, and they stack on the same timeline.
No. Everything you enter is stored in your own browser and stays on your device. There is no account, no login and no cycle data on a server.
Yes. A TRT protocol is the same calculation at a lower dose: pick the ester, the dose and the injection frequency, and the chart shows how far the level swings between injections and how long it takes to settle. Splitting the same weekly dose across more injections flattens that swing, and the curve is where you can see it.
The blood level falls to a few percent of its peak after roughly five and a half half-lives, so a one day ester is effectively gone in under a week and a twenty day one takes about four months. That is the serum level only. It is not a detection window — testing looks for metabolites, which are found long after the parent compound has cleared.
Yes. There is nothing to pay for and nothing to sign up to.